Real-Time Monitoring

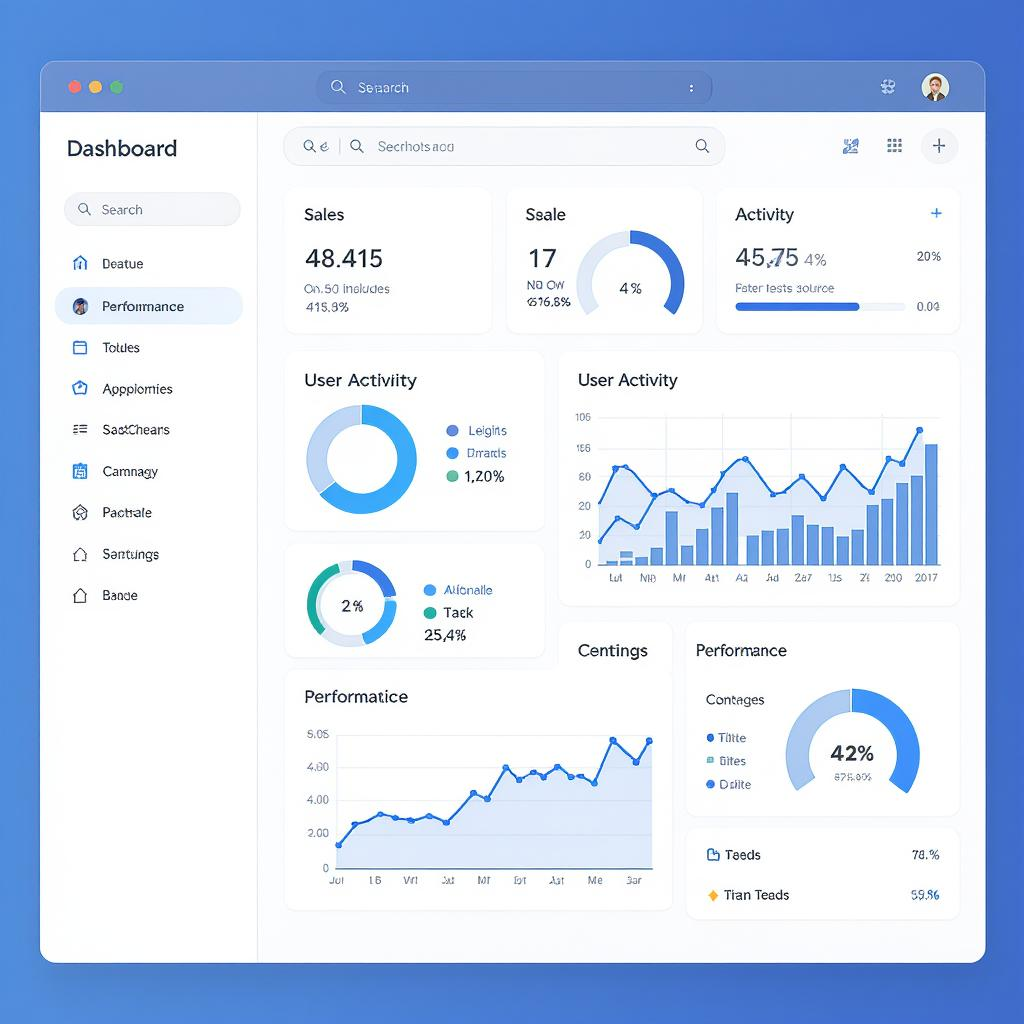
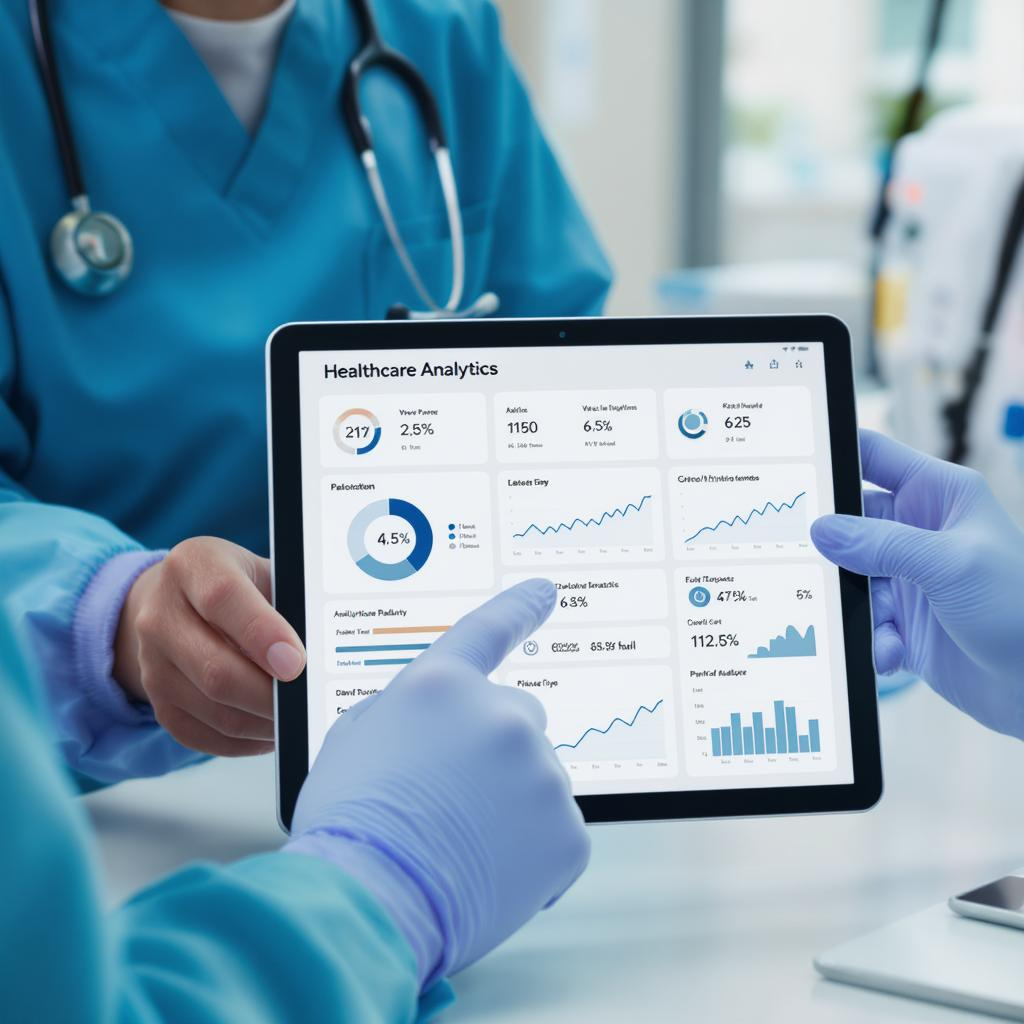
Our real-time monitoring system provides instant visibility into your operations with millisecond precision. Watch as data streams in from multiple sources, giving you an up-to-the-second view of your entire ecosystem.
The live dashboard preview allows you to track key performance indicators, system health metrics, and business analytics as they happen. Customizable widgets let you focus on what matters most to your organization.
With our advanced alerting system, you'll be notified immediately of any anomalies or threshold breaches, enabling rapid response to critical situations before they escalate.
Instant Data Processing
Our system processes incoming data streams immediately, eliminating any lag between event occurrence and dashboard updates. This ensures you're always working with the most current information.
Multi-Source Integration
Aggregate data from APIs, databases, IoT devices, and custom sources into a unified real-time view. Our platform normalizes disparate data formats for seamless monitoring.
Historical Context
While focusing on real-time data, our system automatically maintains historical context, allowing you to compare current metrics against past performance with a single click.
Advanced Analytics
Beyond simple monitoring, our platform provides powerful analytical tools that process your data in real-time. Detect patterns, predict trends, and identify anomalies as they emerge.
Machine learning algorithms continuously analyze your data streams, learning normal patterns and alerting you to deviations that might indicate opportunities or threats.
Customizable analytical models let you define the specific metrics and relationships that matter most to your business, with results visualized in intuitive, interactive formats.
Customizable Alerts

Configure precise alert conditions that trigger only when specific thresholds are crossed or patterns emerge. Avoid alert fatigue with intelligent suppression and escalation rules.
Receive notifications through your preferred channels including email, SMS, mobile push, and integration with collaboration tools like Slack and Microsoft Teams.
Our alert system includes built-in escalation paths, ensuring critical issues are never missed even if the primary responder is unavailable.
Collaboration Features
Shared Annotations
Leave notes and markers directly on dashboards to highlight important events or share insights with your team in real-time.
Incident Response
Coordinate response efforts with built-in workflows that guide your team through resolution processes while maintaining full audit trails.
Role-Based Access
Define precise access levels for team members, ensuring everyone sees only the data and controls appropriate for their role.
Performance Metrics
Track system performance with comprehensive metrics that monitor everything from data processing speed to user engagement with your dashboards.
Our platform provides detailed analytics about your analytics - helping you understand which metrics are most valuable to your organization and how they're being used.
Custom benchmark comparisons let you measure your performance against industry standards or your own historical data to identify areas for improvement.